The ratio of the BHP (Brake Horse Power) and the IHP (Indicated Horse Power) is known as the Mechanical Efficiency. The BHP is calculated by subtraction of the total mechanical loss from the IHP. The losses are attributed to work done against friction of the rotating and reciprocating components. This is known as the FHP (Friction Horse Power). In addition there is a loss in pumping the mixture through the crankcase called the PHP (Pumping Horse Power).
BHP=IHP-(FHP+PHP) MECHANICAL EFFICIENCY=BHP/IHP
The mechanical loss is due to
- Rolling, and rubbing friction of the components.
- Air resistance of rotating components.
- Vibration.
- Pumping loads.
FRICTION HORSE POWER
To predict the BHP we need to establish the FHP. This is feasible based upon the dimensions and weight of components. Piston/Cylinder friction is often assumed to be the major factor causing power loss. Whilst this may be true to some extent, with a poorly designed example this should not be confused with an incorrectly fitted assembly which needs running in. Losses due to piston thrust loads and sliding friction, although significant, are not as critical as might be expected. The losses attributed to piston fit or any rings which may be used are speculative. If no rings are fitted and a tapered bore applied, only a small additional loss will occur with suitable matching of the thermal expansion coefficients of the piston and cylinder materials.
With rings, it is claimed that cylinder pressure forces these to expand against the cylinder bore; in addition they have to be compressed to fit within the bore. Hence the load applied would be a combination of these two factors. The load attributed to cylinder pressure is likely to be false. The effective area over which pressure is applied can only be the piston cylinder clearance annulus. Actual pressure is determined by the leakage rate. It would appear this force is in the direction of piston travel. As a consequence it cannot simply be added to that of ring compression. Combined forces are created, which are difficult to predict.
The loads which are applied to the cylinder and other bearing surfaces arise from two principal sources, gas pressure on the piston, and inertia loads of the reciprocating components. What must be appreciated is the effect the weight of these items has on loading. The loads generated increase as the square of the RPM. Full size engines require added balance weights to minimize peak loads and prevent failure. Changes to the bore/stroke ratio must be carefully examined since component weight has to be balanced against the desired angular acceleration (useable RPM). The ICE program provides graphs of effective loads during rotation. These include cylinder wall side thrust, connecting rod load, crankpin load, crankshaft journal load and others including balance.
ICE calculates the mean effective load in each case. The mean loads due to Inertia are determined by the number of angular increments applied not the volume increment. From this the individual FHP loss of each item is determined. Observation of increasing RPM calculations reveals the peak in BHP curve and decline in mechanical efficiency. The loss due to each specific item can be examined - this is important in the design and development situation.
The objective of introducing a balance mass is to reduce the magnitude and variation in load applied at the crankshaft main journal. It does not directly reduce loads applied to other components. If however the frequency or magnitude, of balance error is large a cyclic load can be transmitted to other components, this may cause premature failure. The crankcase must be substantial enough not to resonate at a similar or harmonic frequency of the operational RPM. With a single cylinder engine it is not normally possible to balance the secondary components due to Inertia, these occur at 90 degree intervals, and would require additional mechanism to achieve this. An attempt can be made to balance the primary component which peaks at 180 degree intervals. To achieve this, a balance weight is added to the crank disc at 180 degrees to the crankpin or material removed from the crankpin half of the disc. When this is done a horizontal component is introduced at 90 degrees to the cylinder axis. In view of this only a fraction of the reciprocating weight is balanced. Too high a ratio simply rotates the balance plane. Cylinder pressure acting on the piston is part of the summation of load and varies according to scavenge efficiency. The balance error and subsequent bearing loads change over the engines RPM range. Whilst the generated Inertia loads are directly proportional to the RPM^2, the pressure loads do not have the same relationship. The objective should be to set the balance factor to suit the desired RPM. A percentage around 33% set at a radius equal to the crank throw appears satisfactory. There is no simple answer because of the variation in weight of the components. The lighter the components, the higher the percentage balance which can be applied. Figures quoted of 66% only appear feasible with very light components. The removal of small amounts of metal from the crank disc as suggested by some tuning exponents will have little, if any, benefit. Increasing balance weight to compensate for excessively heavy components is not a solution.
The crankpin bearing FHP may exceed that of the crankshaft journal. Which creates the highest loss is determined by the bearing type and diameters. Whilst many model engines have ball bearing mounted shafts, few if any incorporate one for the crankpin, hence the critical nature of this bearing. The crankpin bearing is subjected to higher loads than the gudgeon pin. The gudgeon pin is only subjected to the summation of gas pressure, piston and gudgeon pin Inertia. Where as the connecting rod Inertia is added to this when applied to the crankpin. This accounts for the difference in diameter of the gudgeon pin, and crankpin bearings.
Loading and action on the crankshaft bearing is different to that of the crankpin or gudgeon pin. The pressure point is towards TDC passing through that location and in the opposite direction passing through BDC. This is constantly changing, producing a combination of rolling and rotation of the applied load due to the centrifugal forces. Offsetting the crankshaft bearing from the intake port, featured on some ball bearing engines, appears illogical since the same objective can be achieved by increasing the shaft clearance.
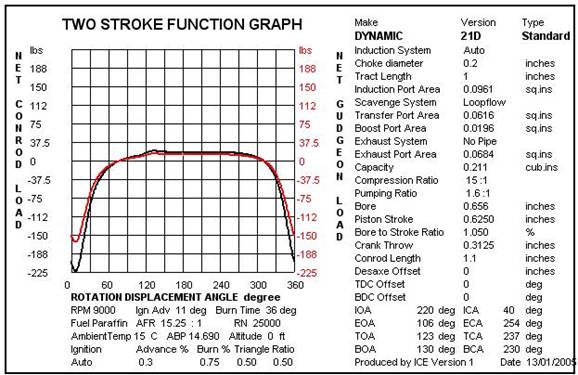
Graph indicating connecting rod load reversal at maximum torque.
The crankpin bearing load curve illustrates the magnitude of stress reversal in the connecting rod. This would also be the crankshaft journal load in an unbalanced system. With a balance system the force moments rotate about the crank centre creating a load towards or away from this according to the convention applied. Hence the plot is shown in absolute relationship to the crank centre. The reduction in the vertical loads applied passing through TDC and BDC are readily observed.
CALCULATING THE MECHANICAL EFFICIENCY
The Ice program provides nine different pages of analysis. Calculations are made over a range of increasing RPM, the output data can be used to plot a curve. Detailed analysis can be observed from other pages. It works like a spread sheet. Naturally the parameters used for the appraisal are restricted, the purpose being to provide comparison data. All loads are assumed to be directly applied, in other words no account has been made of any load offset. The calculations do not apply correction attributed to deflection under load. Two types of bearing are considered plain journal and ball bearing. As a consequence a selection is automatically applied of either of two coefficient of friction calculations. Since it has been stated that the coefficient of friction reduces with increasing pressure, and bearing area is not currently included in the calculation, a compromise has been set. No consideration is made of the application of different lubricants. This is not essential since our purpose is to determine differences due to mechanical design.
Additional parameters can be added as proved necessary by program development.
DETERMINING FRICTION HORSE POWER
The mechanical losses calculated by the ICE program are determined by friction curves. Users can alter these from the default conditions.This feature has been implemented due to the range of materials, lubricants and other factors affecting the engine's Mechanical Efficiency.
The coefficient curves apply the formulae - U = C + VX^n
U = Instantaneous Coefficient of Friction
C = Break Away Constant (Base)
V = Velocity
X^n = Gradient or Rate of Change with Velocity
If a negative value is set for the gradient X then the coefficient declines with increased velocity.
If a positive value is set for the gradient X then the coefficient increases with increased velocity.
The default values are negative, this is normal as breakaway friction is higher than sliding.
^n = Exponent to permit curves other than a straight line
If Exponent ^n is set to 1 a straight line is produced.
If ^n is set to 2 the decrease is quadratic.
A facility is included to account for Piston fit, this is an essential feature with small engines not fitted with piston rings.
PUMPING HORSE POWER
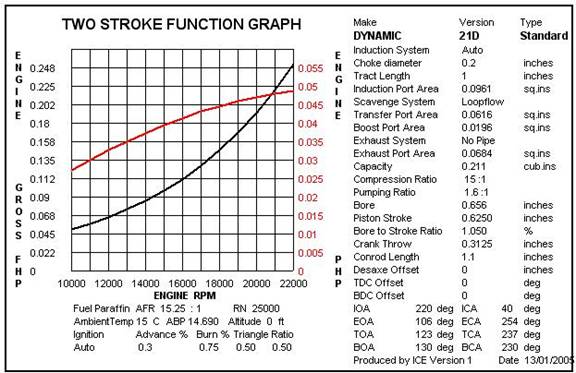
Graph indicating the increase in FHP and PHP, at escalating RPM.
The PMEP (Pump Mean Effective Pressure) is calculated from the area contained within the crankcase pressure/volume diagram. By applying this to the normal formulae for HP, the PHP is determined, the method being identical to that applied for IHP and BHP. There is no difficulty with these calculations when a suitable computer program is available. Although the peak pressure during the compression phase may be as high as 25 psia, the induction creates minimal depression. Since transfer may not be completed until some time after BDC the PMEP is unlikely to exceed 5 psi. This is very low compared to IMEP which will exceed 100 psi. Hence the PHP with natural aspiration should not exceed 5% of the IHP in normal circumstances. Crankcase compression ratios rarely exceed 1.6:1, reducing the clearance volume being difficult. The effect this has on induction, transfer and scavenging is evaluated in subsequent topics.