In most circumstances Engine Timing is illustrated by means of a Clock Diagram, unfortunately this is an inadequate statement of engine function. It provides the designer and user with information regarding the Mechanical limitations of the engines porting. It does not provide any indication of how efficient or balanced the porting is.
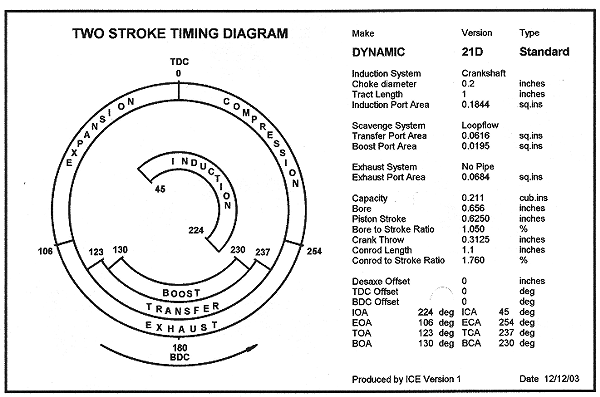
THE CLOCK DIAGRAM
The clock diagram is useful at the design stage to establish potential port size for all functions, there has to be a balance between the ports if the required flow rates are to be achieved. The layout of these ports is determined by the Scavenge system to be employed. It is important to appreciate under what circumstances a particular system is best suited.
Before considering any port or timing modification, either a considerable amount of testing or computer analysis is desirable. Computer analysis is by far the safest approach because you have a complete picture of the possible outcome.
Whilst so called tuning experts may recommend raising the cylinder using shims to increase RPM, my experience is that unless there is a major manufacturing error no significant power increase can be attributed to this. To raise RPM you must increase flow rates, these are determined by the port area, delivery coefficient and pumping pressure. The problem is that you do not change the Exhaust and Transfer relationship and a reduction in working cylinder capacity occurs. Raising the cylinder reduces the pump delivery pressure, the most important feature with regard to Scavenge Efficiency.
The advance opening of the Exhaust port relative to the Transfer (Scavenge) port is required to minimise the pressure difference between the Cylinder and Crankcase chambers and avoid reverse flow. It is difficult to achieve a Crankcase Pressure greater than 26 psia, at the point of Transfer Port Opening with naturally aspirated Two-Strokes. Normally Exhaust commences between 80 to 100 psia, depending on the desired engine RPM range. Premature opening of the Transfer Ports should be avoided due to the reasons indicated.
The Induction and Scavenge systems need to be closely matched. An engines delivery pump (Scavenge system) determines the maximum flow rates, the minimum is determined by the choke size or Throttle and Induction porting. Because both use the crankcase chamber as a reservoir, Induction cannot normally exceed the Scavenge flow. Currently many model engines feature excessive Induction Periods. This appears to have occurred due to cut and try methods. The problem to be resolved is the Rate of Change of Port Area with respect to pumping displacement
.
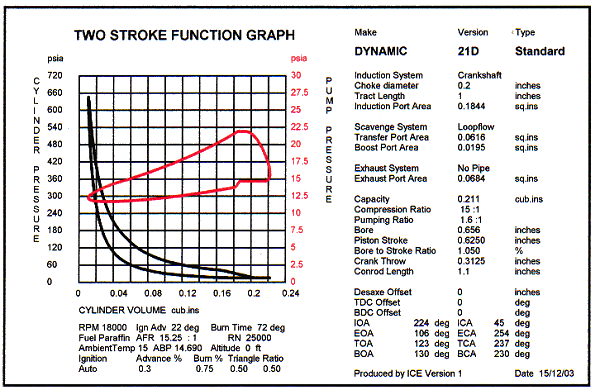
THE PRESSURE / VOLUME DIAGRAM
In full size practice PV (Pressure/Volume diagrams) are generated during test. These diagrams indicate the cylinder pressure cycle over a range of engine RPM. The importance of this is that the area contained within this diagram determines the engine output (Torque and BHP). The MEP (Mean Effective Pressure) is determined by the area contained within enclosed loop, the greater the area the higher the engines Torque and HP.
Both Cylinder and Pumping system diagrams are required to assess and illustrate the engines potential performance at a specific RPM. Similar diagrams with respect to Temperature assist in the Study of Combustion and Scavenge functions.
Diagrams can be plotted with alternative X-axis, the options are Rotation Angle (0 to 360 degree's), Stroke or Cylinder Volume. The example above applies the Volume option.
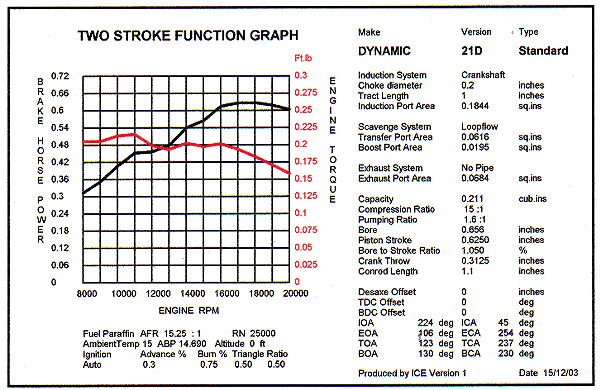
FLOW TIMING DIAGRAMS
At first instance users may not see these as timing diagrams, eventually however the application becomes apparent. The addition of the Curve fitting and plotting function permits analysis over a range of RPM to be reviewed. This is not limited to the default curve plotting functions.
Port flow can be evaluated in various units, the user will no doubt have a personal preference. What is most appropriate will depend on the analysis required. All of these are included in the Evaluation default list.
In some circumstances it is necessary to determine that; the volumetric efficiency can be matched or is applicable to the engines Mechanical efficiency. This can be critical with Induction systems. The graph that follows illustrates a timing problem. Plotting an Induction and Exhaust flow diagram in the critical speed range indicates there is a problem with overlap of the Scavenge and Induction ports. When Induction opens blow back occurs; if the same cylinder porting is evaluated with an automatic inlet valve the problem is resolved. Hence modification is required to the rotary port design; this will increase the IMEP improving power output.
The above Flow diagram demonstrates unsatisfactory Induction and Scavenge port timing.
Blow-back does not cease until 20000 RPM is exceeded. BHP does not increase because the Mechanical efficiency is not high enough at that speed (the crankshaft is not mounted on ball bearings.